The World in Data: A Website Dataviz to Analyze Global Activity
In the current digital landscape, online activities outline the contours of a new world map where people interact with technologies. This phenomenon is particularly noticeable in the field of computing, where professionals are interconnected through a global network, marked by peaks and troughs of activity that follow geographical areas and time zones. By studying the connections to our website dedicated to DevOps, we can glimpse the habits and preferences of this community of technical experts.
Our analysis reveals not only the areas of high professional concentration but also offers insights into technological choices and digital access across the world. This mapping of digital rhythms allows us to observe not only where but also when and how engineers interact with our platform, thus providing an indirect measure of global activity in this sector.
By diving into the analysis of these digital pulses, we embark on a journey through the daily habits of engineers, while deciphering the broader signals that these data emit in the context of the globalization of our economies.
- Introduction to Interactive Dataviz
- Geographical Distribution of Visitors
- Operating System Usage
- Search Engine Preferences
- Horizontal Activity Analysis
- Conclusion
Introduction to Interactive Dataviz
Our data visualization tool is designed to offer an immersive experience in analyzing user engagement data from our website specialized in DevOps. Thanks to the use of the JavaScript library Leaflet, we have created an interactive map that illustrates the geographical distribution of visitors, as well as the intensity of their interaction with the site’s content.
The map uses color markers and layers to represent different levels of activity, allowing users to quickly identify the hotspots of web traffic. This real-time interaction allows the user to discover activity patterns that might otherwise remain hidden in simple data tables.
Moreover, our dataviz offers the possibility to filter data by operating system and search engine. This level of customization reveals technological preferences by region and can help understand how cultural, economic, and political factors influence web usage and the choice of digital tools.
The zoom functionality allows examining specific areas in more detail, providing a microscopic view of specific regions and their engagement with the site. This tool is not only a means of displaying data but also a platform for exploration that invites analysis and discovery.
Visualizing activity by hour of the day is another fascinating aspect of our tool. A circular graph illustrates the site’s activity over a full day, revealing a wave of engagement that spreads from east to west, following the sunrise across the meridians. This phenomenon highlights the global nature of the DevOps community and its work patterns synchronized with circadian cycles.
Therefore, this dataviz is not just a means of presenting data; it acts as a visual narrative that transforms numbers into stories, allowing users to understand the complex nuances of online activity among IT professionals.
Geographical Distribution of Visitors
The analysis of the geographical distribution of visitors to our website reveals a mapping that goes beyond borders, unveiling peculiarities that reflect both the global adoption of technologies and specific local and regional trends.
Europe
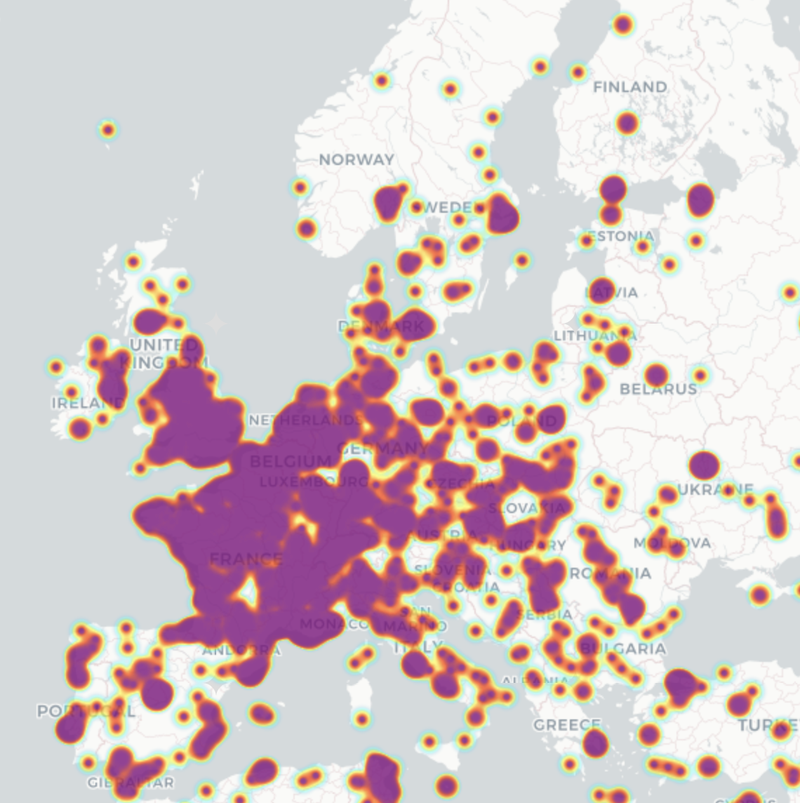
In Europe, we notice a strong engagement with a total of 13,000 visits. France stands out particularly with 6,500 visits, which can be attributed to the fact that half of the site’s content is available in French. Germany and the United Kingdom follow with 1,100 and 800 visits respectively, highlighting the relevance of our content in these technological hubs.
Zooming in on France, it is interesting to note that the distribution of visits follows the famous “diagonal of emptiness,” a geographical area extending from the northeast to the southwest where the population density is low and economic activity is lesser.
The United Kingdom presents a particular geographical distribution as well, divided in two, highlighting the economic poles and clusters of companies specialized in computing mainly concentrated in the southern half of the country.
Spain is an excellent example of how computer activity is primarily concentrated in urban areas. The activity is essentially centered around a few major cities such as Madrid, Barcelona, Valencia, and Seville. This concentration indicates the location of technological hubs and innovation ecosystems in the country.
In Germany, the distribution is more homogeneous, reflecting the strong industrialization and digital adoption throughout the country, with a notable concentration in regions such as Bavaria, Baden-Württemberg, and around major cities like Berlin, Munich, and Frankfurt, known for their dynamism in the tech and innovation sector.
North America
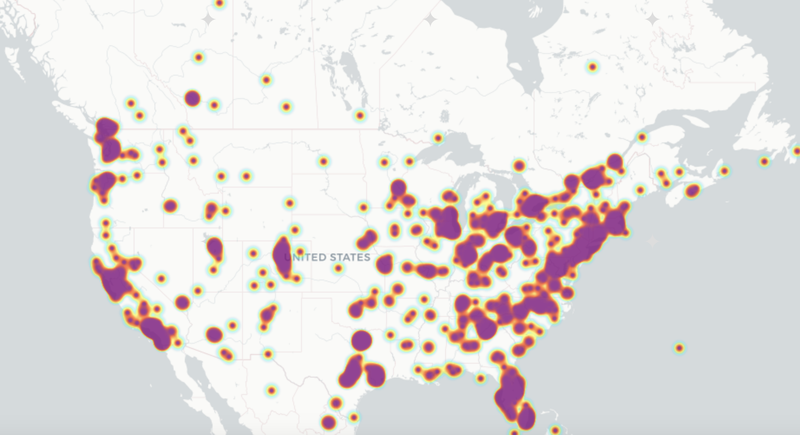
The American continent also shows a significant presence with 5,000 visits in North America, dominated by the United States with 4,000 visits and Canada with 1,000. These figures reflect the influence and adoption of computing tools in these regions.
In Canada, the activity is primarily concentrated near the border with the United States, highlighting the clustering of the population in major southern cities like Toronto, Montreal, and Vancouver, which are important technology hubs.
In the United States, the engagement on our site presents a geographical distribution that underscores a relatively homogeneous activity in the eastern half of the country, encompassing both major technology centers such as New York, Washington, Boston, Chicago, Atlanta, and Miami. On the other hand, the western half of the United States shows a more targeted activity, particularly concentrated on the west coast, in regions such as the Silicon Valley and Los Angeles in California, as well as Seattle in the State of Washington, and inland, near Austin, Houston, and Dallas in Texas, as well as Denver in Colorado.
Asia
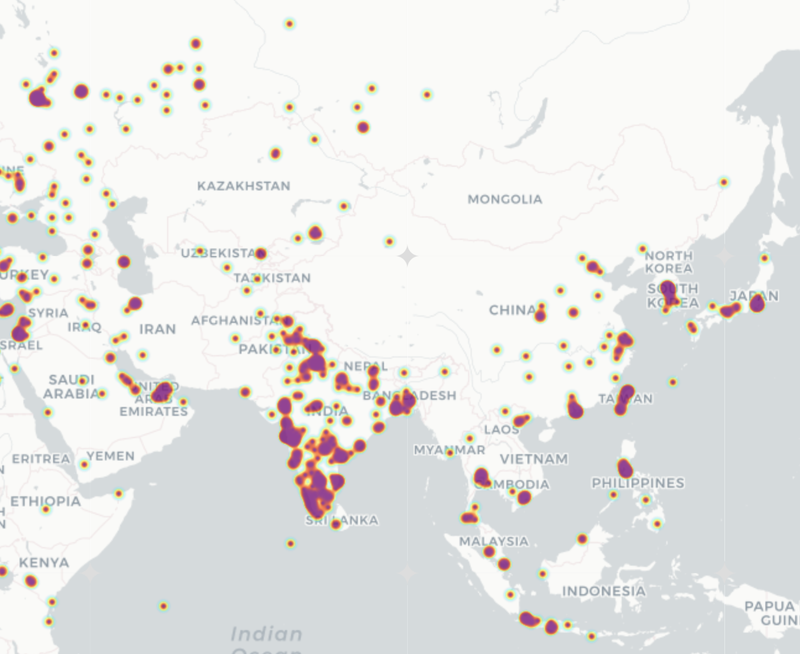
In Asia, our site recorded a total of 4,000 visits, with a notable presence in India (1,900 visits), illustrating the increasing importance of this country in the global IT sector. Russia with 550 visits, China with 400, Japan with 200, and Singapore with 170 also contribute with figures that testify to the global reach of the site, despite linguistic differences or digital barriers. Moreover, significant activity points were observed in Israel (100) and the United Arab Emirates (80), highlighting the influence and adoption of technologies in these strategic regions.
Furthermore, significant activity points can be distinguished in some major cities:
- Taiwan, with its strong technology industry, highlighting the importance of the island in the production of computer hardware.
- Hong Kong, as a financial center with a strong presence of startups and financial institutions.
- Tel Aviv, as a center of technological innovation, where a flourishing ecosystem of startups and innovation culture prevails.
- Dubai, with its commitment to digital transformation and its status as a commercial hub, reflecting the city’s ambition to be a leader in technological innovation.
- Tehran and Moscow, despite regulatory challenges and international sanctions.
Africa
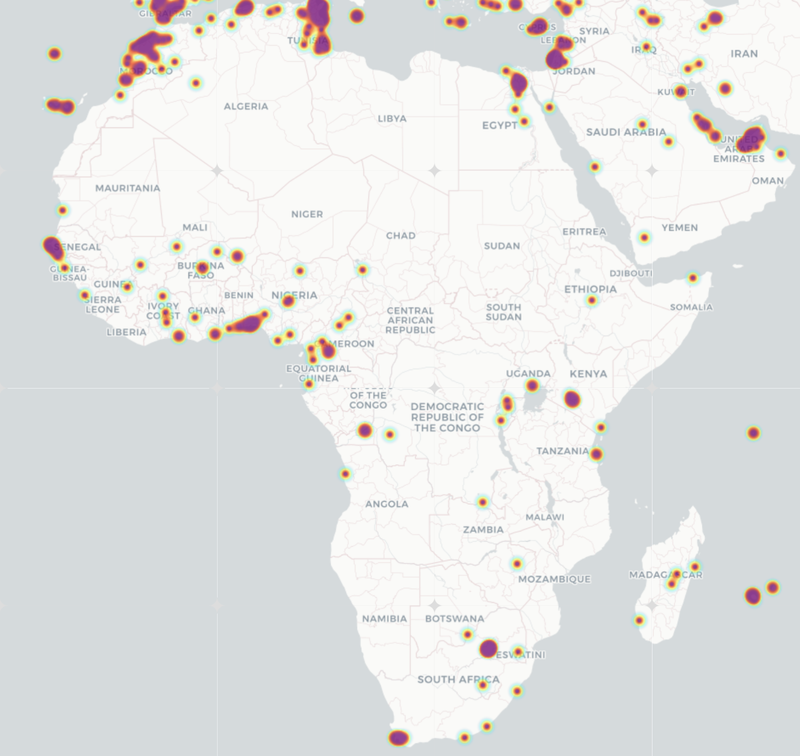
Although Africa presents overall more modest figures, with a total of 900 visits, the engagement is nonetheless notable, particularly in Morocco with 150 visits, in Tunisia with 128, in South Africa with 75, in Senegal with 70, and in Algeria with 61 visits. These data testify to a significant adoption and a growing interest in information technology across the continent, highlighting a distinctive presence from the Maghreb to Southern Africa, crossing the regions of West Africa and the Great Lakes.
The points of engagement in Africa reflect not only a growing interest in information technology but also the presence of dynamic and growing technological communities in these regions:
- Morocco and Tunisia are known for their offshore development centers and for their increasing investment in advanced technological education and training.
- South Africa, with its most diversified and advanced economy on the continent.
- Senegal and Algeria indicate the emergence of technological hubs and an interest in information technology.
- West Africa, with countries like Senegal, Ivory Coast, Benin, and Nigeria, shows the rapid evolution of technological sectors in this region.
South America
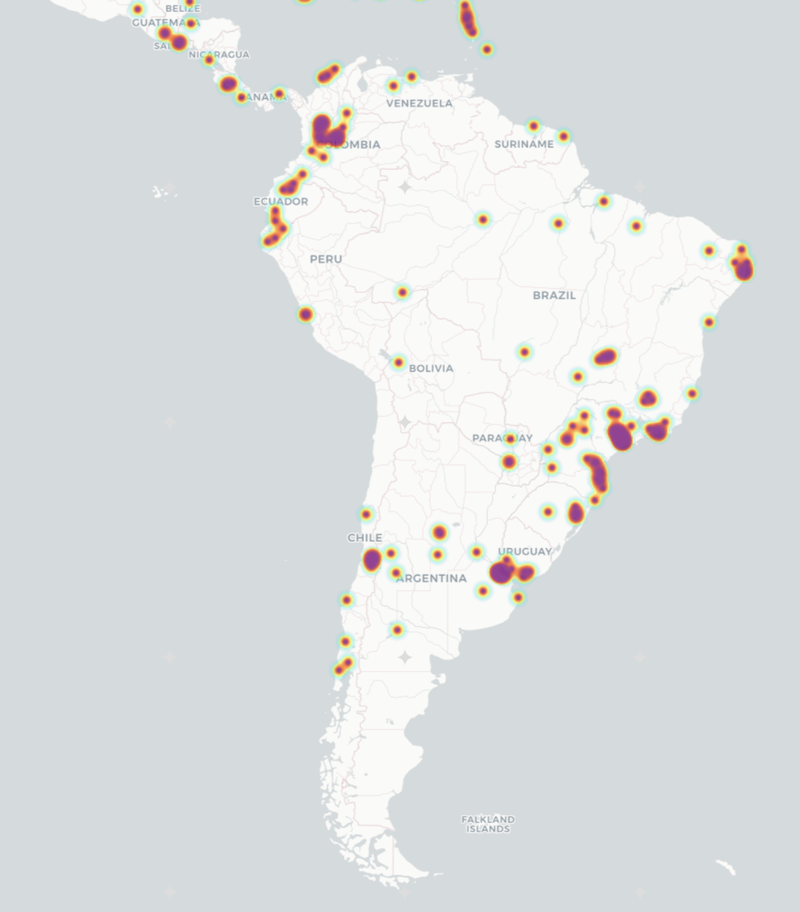
South America shows 500 visits, led by Brazil with 250 visits, followed by Colombia with 100 visits, Argentina with 65 visits, and Chile with 50 visits. This region displays growth potential given the rapid evolution of its technology sector.
It is the metropolises like São Paulo, Buenos Aires, and Santiago that gather the majority of visits and illustrate the central role of these cities as regional technology hubs.
Oceania
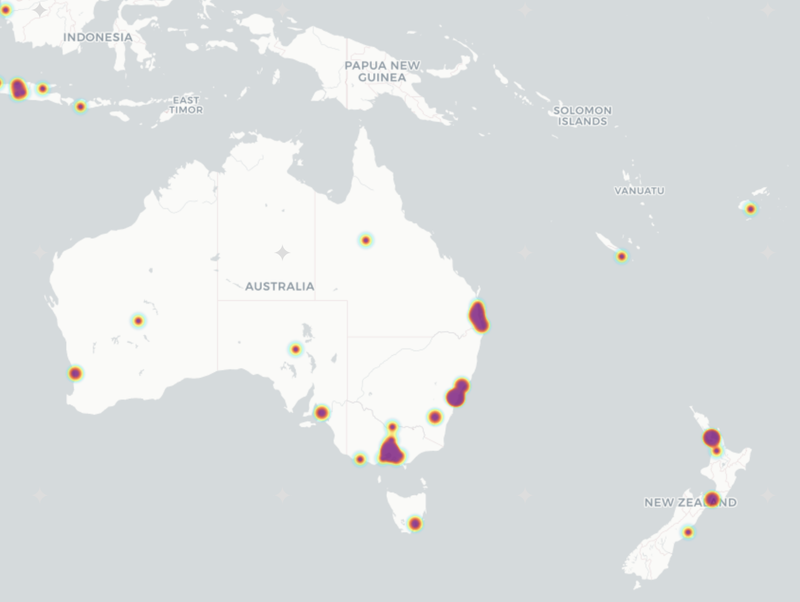
In Oceania, Australia leads with 250 visits, closely followed by New Zealand with 50 visits, illustrating how the internet connects remote regions of the globe:
- Australia shows a notable peculiarity, with activity mainly localized on the east coast. The cities of Sydney, Melbourne, and Brisbane form a triangle of technological innovation.
- In New Zealand, activity is centered around Auckland and Wellington.
This global overview not only demonstrates the international reach of the site but also underscores the importance of considering languages and local contexts in a content strategy. The predominance of engagement in certain countries reflects the concentrations of specialized engineering populations and local technological ecosystems, providing an updated view of global economic activities in development and operations.
Operating System Usage
The study of the geographical distribution of operating systems used by our visitors reveals significant trends reflecting technological preferences and usage behaviors in the field of computing. The visualized data show variable concentrations according to regions and operating systems, offering an interesting view of user engagement and their preferred work environment.
Windows
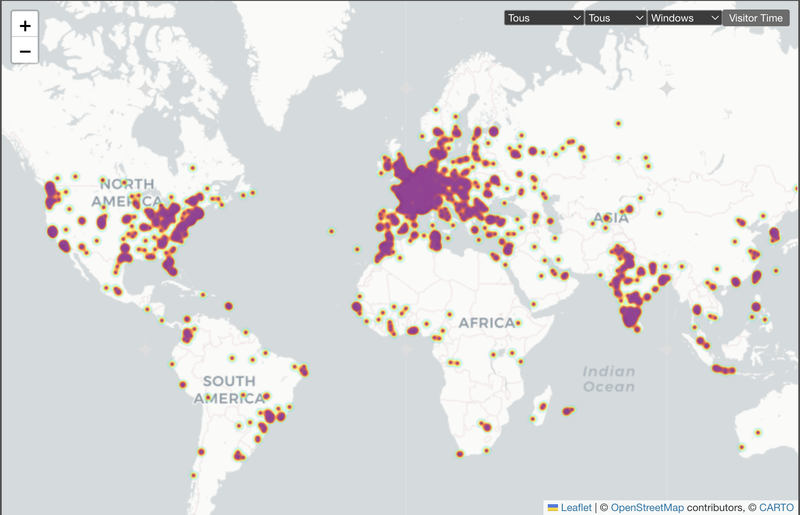
Users of the Windows operating system show a high density primarily in North America, Europe, Asia, and the Maghreb. This dominance could be explained by the wide adoption of Windows in business and educational environments, as well as its compatibility with a multitude of development applications.
macOS
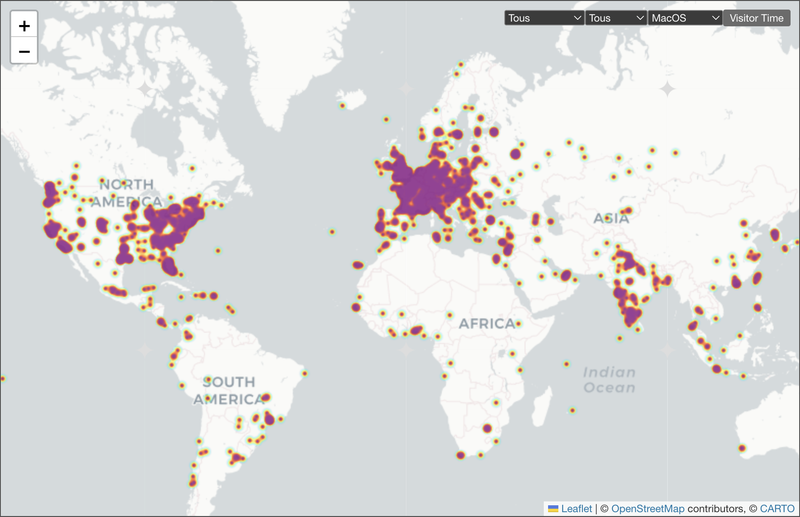
The distribution of macOS users, although generally less dense than that of Windows, shows areas of intense activity, especially on the west and east coasts of the United States, as well as in parts of Europe. These hotspots could indicate a higher economic level, as Apple devices, often perceived as high-end, are more commonly adopted by users with greater financial means.
iOS
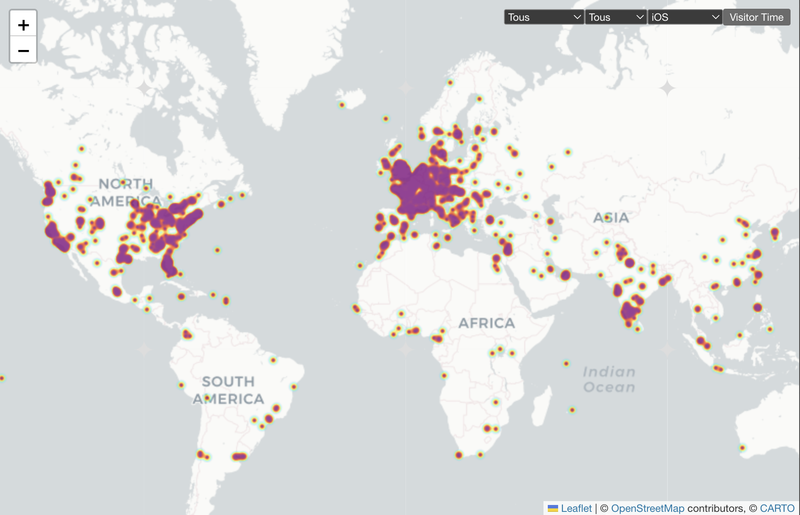
The use of iOS on mobile devices is significantly higher in densely populated and technologically advanced urban areas, such as major cities in the United States, Western Europe, and innovation hubs in various countries. This indicates that inhabitants of these regions again enjoy a higher standard of living, allowing the acquisition of devices considered more expensive, and reflects their interest in cutting-edge technologies.
Android
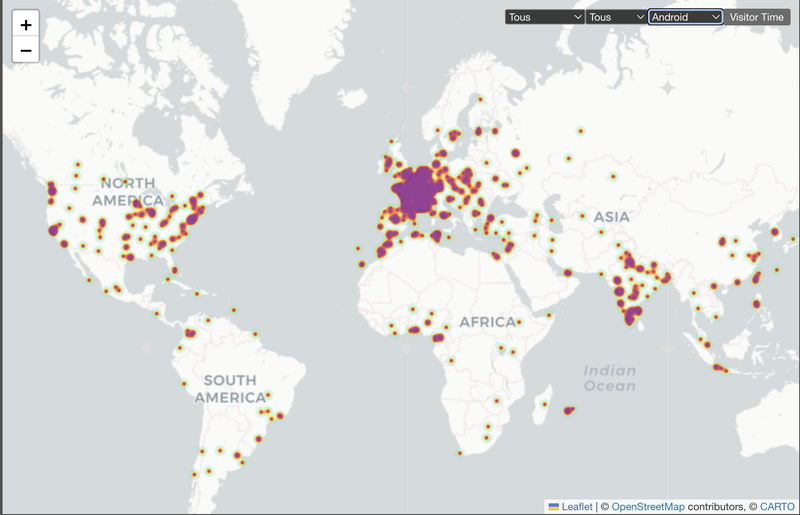
The use of Android is characterized by its more homogeneous distribution across the world, indicating a strong market penetration in various economic and cultural contexts. It is found in regions less represented by other operating systems such as South America, Africa, and South Asia. This may indicate a prevalence of Android in regions with lower hardware costs and a greater diversity of devices.
GNU/Linux
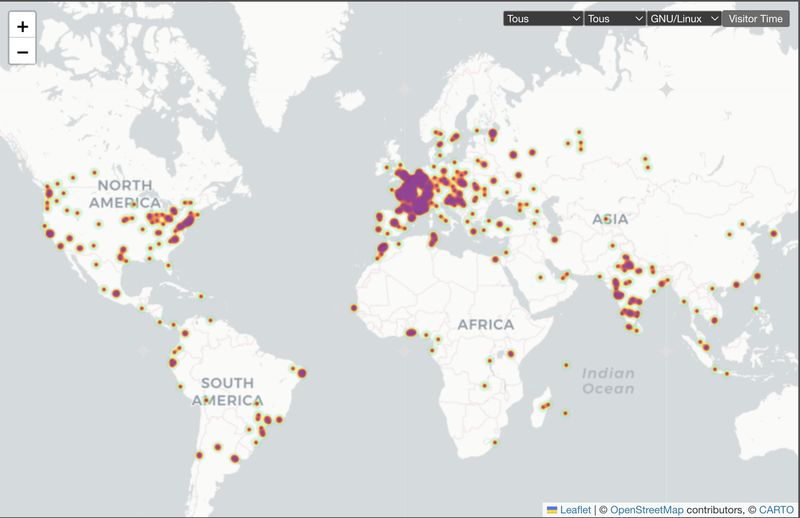
The GNU/Linux system, while representing a more modest share, shows significant use in specific areas, such as research centers, universities, and technology companies, reflecting its use on servers or by developers for its robustness and adaptability for advanced technical needs.
The map reveals less dense areas, which matches expectations since Linux is often preferred by a more technical audience and less by the public. This also sheds light on the location of data centers and major computing centers, illustrating how Linux is essential in critical infrastructures and intensive computing operations.
In conclusion, analyzing the operating systems used to access our site highlights the diversity of work environments and user preferences. Their distribution is quite homogeneous, and this dataviz does not allow for the extraction of significant information on specific usage behaviors or regional preferences. However, some emerging trends can be highlighted:
For example, the increased use of macOS and iOS in developed regions could reflect a higher purchasing power that favors Apple brand products.
Moreover, the data reveal that the Android operating system, with its greater accessibility, continues to dominate in emerging markets. Its significant presence in these regions suggests a predominance in the adoption of affordable mobile technologies.
As for GNU/Linux, its discreet but notable presence in specific areas denotes a preference for open and reliable operating systems, often favored in technical centers and academic institutions.
Despite the apparent uniformity, it would be interesting to perform a more granular analysis. Minor fluctuations in the use of operating systems, when examined over a longer period or with more detailed demographic data, could reveal substantial information in technological preferences.
Search Engine Preferences
This analysis sheds light on the various ways internet users access our site, revealing preferences that significantly vary by geography and user interests.
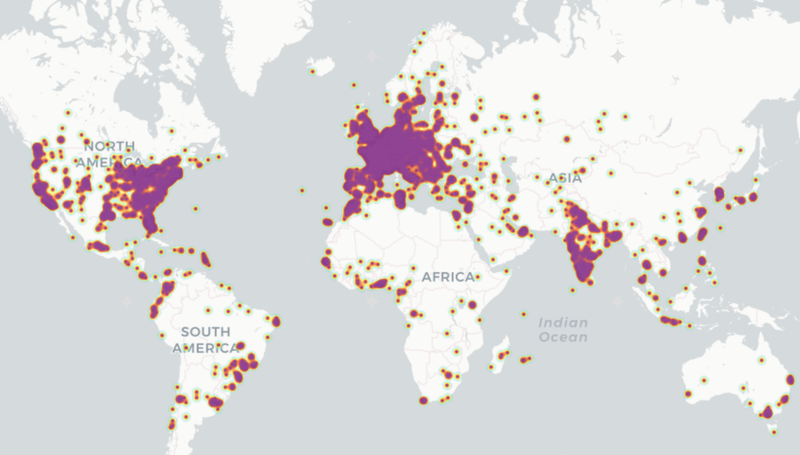
At the top of the list, Google overwhelmingly dominates with 17,100 visitors, confirming its status as the preferred search engine globally. Its ability to attract such a considerable number of visitors underscores the importance of being well-indexed on this platform.
Bing
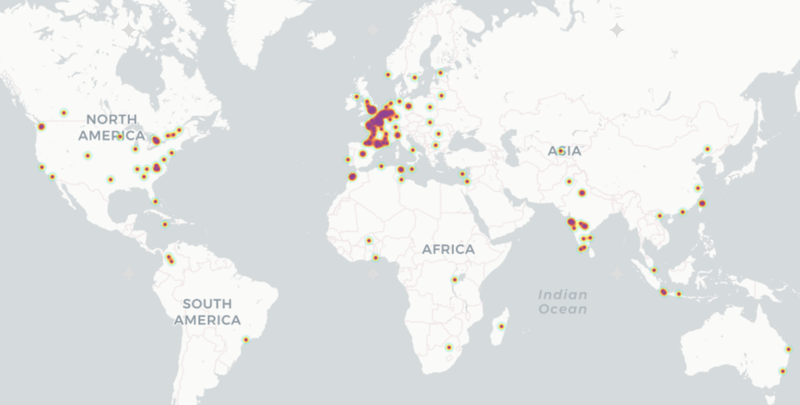
Bing, with 350 visitors, shows popularity spread across Europe, India, and North America, illustrating its solid presence as an alternative to Google, often due to its integration into Microsoft products.
Yandex, Baidu
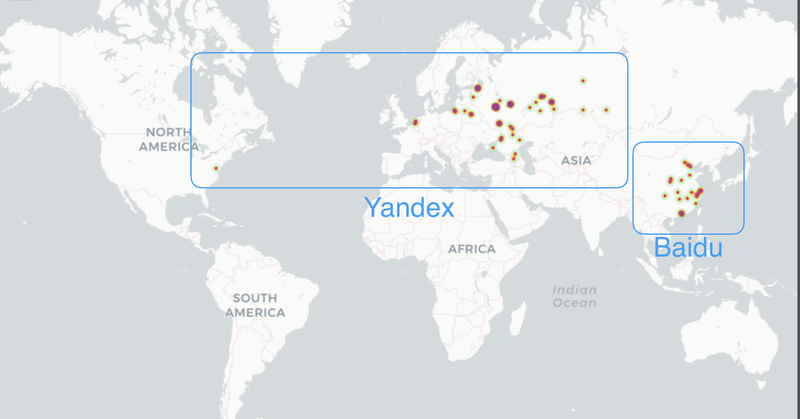
Yandex, attracting 320 visitors, stands out for its strong presence in Russia, but also receives some visits from Belarus, Lithuania, the Netherlands, and Washington in the United States. This reflects its reach within Russian territory despite a few exceptions.
Baidu, the Chinese search engine, attracts 80 visitors, a modest figure considering the large Chinese population, suggesting that Baidu significantly favors local content, potentially limiting the visibility of international sites among Chinese users. This trend could reflect internet censorship practices or local cultural preferences, influencing how information is consumed in China.
Brave, DuckDuckGo, Qwant
Privacy-focused search engines like Brave (220 visitors) and DuckDuckGo (230 visitors) show a notable preference in North America and Europe, reflecting a growing awareness in these regions of the importance of personal data protection. Qwant, with its 40 visitors, focused in France, indicates there is still work to be done before it can compete with Google.
Twitter, LinkedIn
Twitter, with 150 visitors, demonstrates its utility as a social networking platform for reaching users worldwide. LinkedIn, with 65 visitors, illustrates the usefulness of professional networks even though it is more focused on Europe and the United States.
Referring Websites
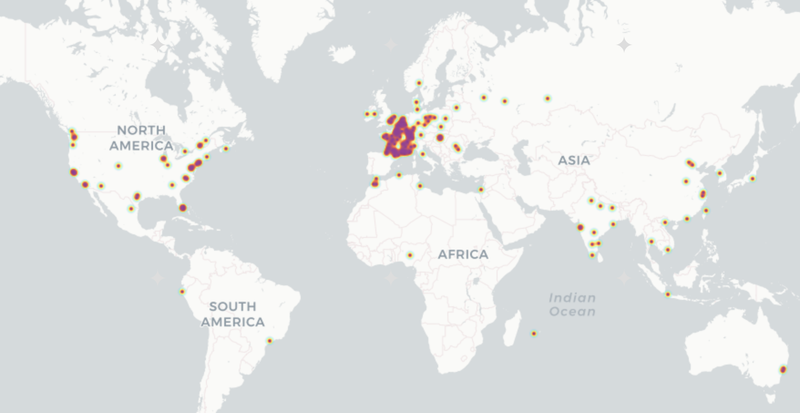
Referring websites also play a key role, with 400 visitors coming from Europe, the United States, India, and China, highlighting the importance of external links and online partnerships.
Ecosia, Yahoo!
Ecosia (25 visitors), mainly used in France, shows the beginning of interest in eco-responsible search engines.
Finally, Yahoo!, with its 30 visitors spread between France, India, and the United States, indicates that it struggles to regain a significant place in the market.
This analysis reveals the multiple ways users access our site, highlighting preferences marked by geographical differences and specific interests. Google stands out significantly with over 90% of site visitors, affirming its global hegemony and the crucial importance of adopting a specific SEO strategy for this platform, to reach a wide and varied audience.
Twitter, compared to LinkedIn, appears more effective for reaching users on social networks. Bing, Brave, and DuckDuckGo, on the other hand, position themselves as alternatives capturing a more modest market share, dominated by the giant Google.
Horizontal Activity Analysis
The horizontal analysis of activities on our site dedicated to DevOps reveals user engagement patterns throughout the day, which follow work rhythms and time zones across the world. A wave moving from east to west with the rhythm of the sun emerges.
Note
To launch the visualization, click on the Visitor Time button. A clock appears, tracing the hours of the day. Click on it again to stop the animation.
Conclusion
By highlighting activity by geographical area, operating system, referral source, and hour, we have revealed insights into the digital behaviors of internet users and global activity zones, revealing how consumption trends and online interactions can influence and be influenced by economic and political dynamics.
This exploration is not limited to a better understanding of visitor engagement; it also raises important questions about our relationship with technology and its footprint in our daily lives. In an era where digital shapes our interactions, leisure, and work habits, the data we have examined invites broader reflection on our digital life.
Ultimately, the digital rhythms of our website are but a reflection of broader trends, inviting us to reflect on the place we wish to give to technology in our lives. As we continue to navigate this ever-changing digital space, let’s take the time to consider not only how we can effectively reach our audience but also how we can contribute to a more conscious and respectful digital ecosystem.

