
Locally install Kubernetes, Prometheus, and Grafana
Sometimes it may be useful for developers to have an effective monitoring toolset installed beside your Kubernetes cluster. The obvious choice would be to go to Prometheus and Grafana, two tools highly recognized.
And that’s when you get into trouble.
In this article I’m going to show you how to succesfully install a complete Kubernetes platform on your local machine particulary on macOS.
Source code
All scripts are kept in https://github.com/scalastic/local-k8s-installation
Notice
- This procedure is intended to work on macOS but should work on any other host. However I was not able to test it.
- Things are more tying up with the Kubernetes distribution (Docker Desktop) than the OS itself.
Kubernetes
We’ll be using Docker Desktop which comes with a ready-to-use Kubernetes cluster.
Download the installer at https://www.docker.com/products/docker-desktop and follow the instructions.
Once installed, activate Kubernetes in the Preferences pane / Kubernetes / Enable Kubernetes.
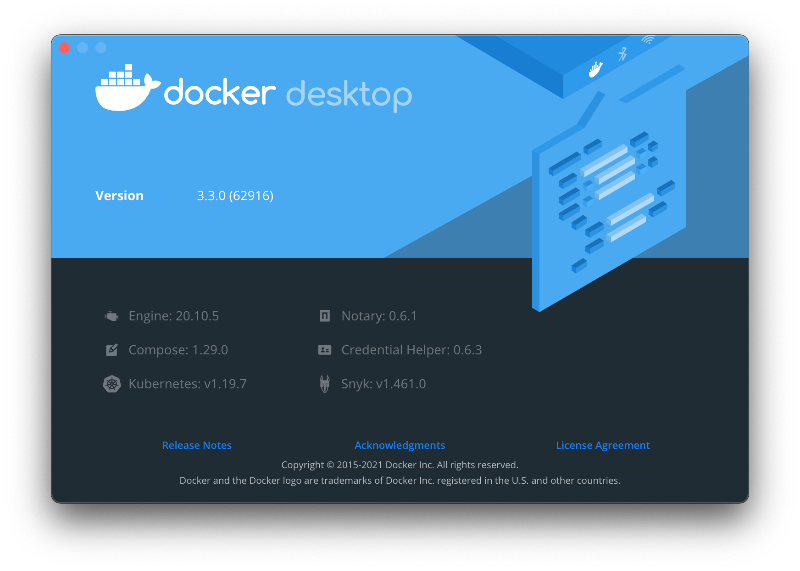
You should now see all the Docker Desktop components in the About pane included Kubernetes:
- Grapple basic information from your cluster to verify everything’s working fine:
% kubectl cluster-info% kubectl get nodes- Or even:
% kubectl get all -A-A parameter
Since Kube 1.14, we don’t have to use the --all-namespaces anymore! So don’t…
Dashboard
Dashboard is a web UI of k8s API and provides an easy way to visualize and debug things. You can find more about Dashboard at https://github.com/kubernetes/dashboard
By default, Dashboard is protected by a token, and each time you’ll access it, you’ll be asked to provide one. It could really be annoying in the long run. Fortunately, Dashboard allows you to bypass the login page by adding --enable-skip-login to the configuration.
Note
The provided configuration file is patched with this instruction (line 198)
To deploy Dashboard - with no authentication - execute the following command:
% kubectl apply -f ./k8s/dashboard-v2.2.0-recommended.yamlThen access your dashboard from your local workstation by creating a secure channel to your Kubernetes cluster. To do so, run the following command:
% kubectl proxyThe address is now:
Tips
I know so don’t forget to bookmark the URL!
You’ll see this login page at first:
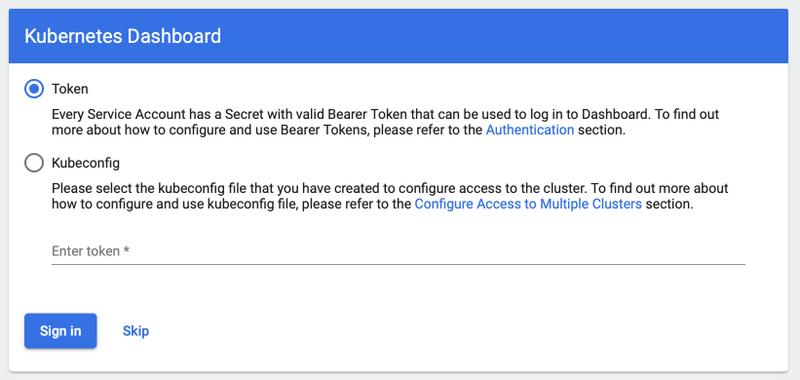
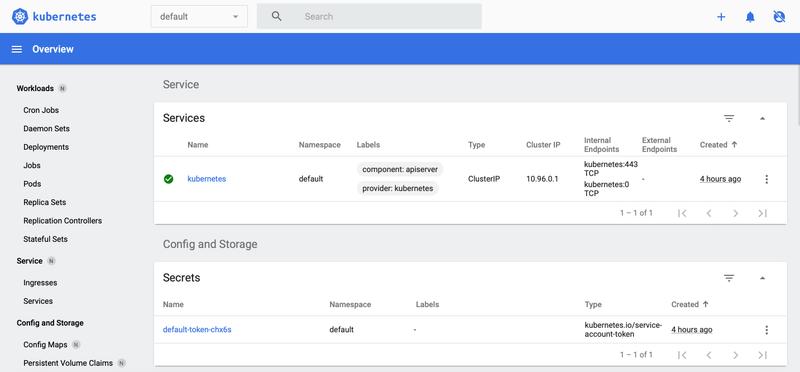
Just push the skip button to bypass authentication.
Metrics Server
Metrics-Server is used to crop metrics from k8s components and exposes them to k8s API. The official repository is https://github.com/kubernetes-sigs/metrics-server
Metrics Server serves the goals of core metrics pipelines: CPU and RAM. The important thing is that Horizontal Pod Autoscaler uses this API to collect metrics. It’s a cluster level component which periodically scrapes metrics from all Kubernetes nodes served by Kubelet. When installed, Dashboard displays automatically this metrics too.
Note
To allow Metrics Server to collect its data over https, the original script has been modified to accept insecure TLS connections by adding - --kubelet-insecure-tls at line 133.
Apply the configuration by entering :
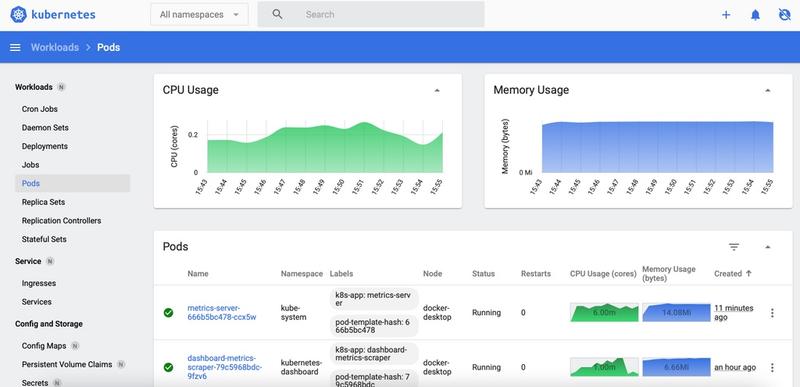
% kubectl apply -f k8s/metrics-server-components-v0.4.2.yamlWhen reloading the Dashboard, you should now see CPU and Memory Usages (after some time) 🌈
You can try the Pods section, this is my favorite!
Kube State Metrics
Unlike Metrics Server, Kube State Metrics is focused on generating numerous metrics from Kubernetes’ object state (e.g. metrics based on deployments, replica sets, pods, etc.). For this, it holds an entire snapshot of Kubernetes state in memory and generates new metrics based off of it.
Having Kube State Metrics enables access to these metrics from monitoring systems such as Prometheus, our concerne here.
To install Kube State Metrics, launch the following:
% kubectl apply -f k8s/kube-state-metrics-v2.0.0-rc.1.yamlPrometheus
Prometheus is a collecting, querying, monitoring, and alerting system. It is useful when it comes to:
- Collects data identified by a metric name
- Stores time-series in memory and on local disk for efficiency
- Allows notifications and alerting depending on data queries
Full documentation is accessible from https://prometheus.io.
Prometheus’ maintainers provide binaries and Docker images for Prometheus components. With a bit of elbow grease, it is possible to create a k8s configuration file with everything we need: Resources access, dedicated role, configuration, deployment, and service exposition.
To install the Prometheus configuration, run the command:
% kubectl apply -f k8s/prometheus.yamlYou can now access Prometheus interface at http://localhost:30000/ … but wait and see!!
Grafana
Grafana (https://grafana.com/grafana/) allows you to « query, visualize and alert on metrics through a powerful user interface » as the site puts.
That's what Prometheus is already doing!?
Let’s clarify : in practice, you will develop your query in Prometheus, and run on Grafana when you’re satisfied.
To configure the Prometheus datasource and install Grafana, run the commands:
% kubectl apply -f k8s/grafana-datasource.yaml
% kubectl apply -f k8s/grafana.yamlGrafana will be listening on http://localhost:3000/. The default login is admin / admin.
Import Grafana dashboard
By default, Grafana comes with nothing specific and you’ll have to configure a dashboard. Fortunatly, you can easilly import pre-built ones via the Grafana interface. The principal dashboards’ source is at https://grafana.com/grafana/dashboards.
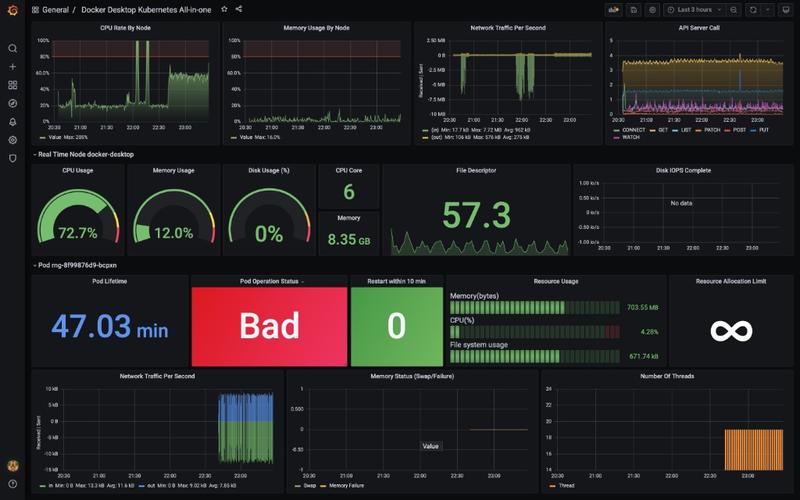
I’ve made one specific to local Kubernetes cluster you can find here Dashboard model.
It looks like this - as you can see, the Grafana graphical interface offers numerous possibilities - unlike Prometheus:
👨🏻💻
Configuring a dashboard in Grafana could be long, costly, and time-consuming. Collecting metrics depends on your host, VM/Virtualization Framework and OS on your pod. You will have to get your hands dirty…
Well, that’s your turn playing with the stack now!
Cheers…


