
JVM vs Native - Configuring Java containers in Kubernetes
In a previous article, JVM vs Native - An effective comparison of performance, I showed how to install a full Kubernetes stack to measure Java microservices metrics. The configuration being long and tedious (the article also probably), I did not dwell on the configuration of the containers.
In this article, we will see why, in a Java application, this configuration is essential and how it impacts the resources consumed by an application.
Source code
All sources are kept at github.com/scalastic/hotspot-vs-native-part2
- Context reminder
- Kubernetes: how a Pod works
- Example of a resource configuration in pod
- Java in Kubernetes
- Demonstration
- Conclusion
Context reminder
Our goal was to compare the execution of a Java application, between its Bytecode (JVM HotSpot) and native (compilation with GraalVM) versions. For this, we have set up a local Kubernetes cluster with Prometheus and Grafana to, respectively, collect and present the metrics. We have also equipped our Java microservices with Micrometer in order to expose the metrics of our applications to Prometheus.
We obtained the following results in Grafana:
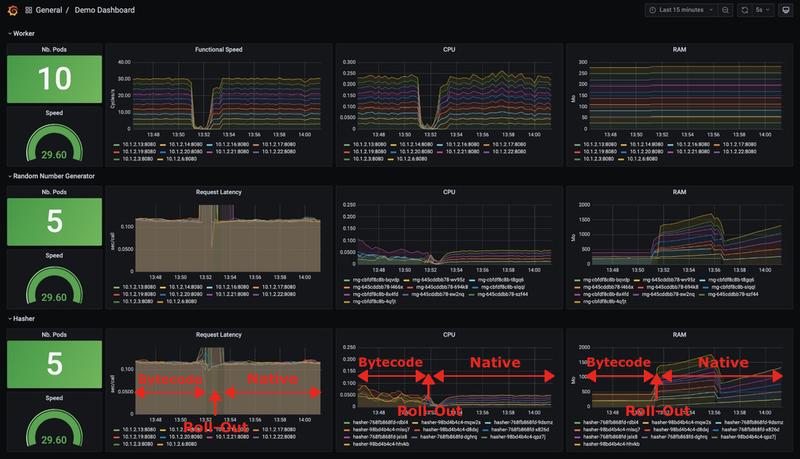
And we find out about:
- Latency
- No change in responsiveness of microservices.
- CPU usage
- In its Bytecode version, CPU usage tends to decrease over time. This is due to the action of the HotSpot C2 compiler which produces native code that is increasingly optimized over time.
- On the other hand, the CPU usage in its native version is low from the start.
- RAM usage
- Surprisingly, native applications use more memory than Bytecode!
Indeed, we had not made any particular configuration to our containers. So it’s time to rectify that now.
Kubernetes: how a Pod works
Attention
By default, when you create a pod, it uses all the system resources of the host machine. It is said !
In order to guard against this, it is necessary to assign resource limits:
- Either at the pod level,
- Or at the namespace level, which will impact, by default, the pods it contains.
Actually, under the hood, these are the cgroups of the Linux kernel that Docker and all Container Runtime Interfaces take into account when allocating resources.
The different types of resources in Kubernetes
Currently, they are of 3 kinds:
- CPU
- Memory
- Hugepages (since Kubernetes v1.14)
The CPU and Memory type resources are called computing resources. Hugepages are virtual memory optimization mechanisms that reserve a large amount of memory rather than multiple chunks which increases system performance.
Soft and hard limits
In the OS, the resource limits are of 2 kinds:
- Soft limit: quantity of resource required
- Hard limit: maximum quantity authorized
We also find these two limits in Kubernetes to manage pod resources:
- requests for the quantity needed
- limits for the maximum quantity
Good to know
If you only specify limits, Kubernetes will automatically assign the same value to requests.
Resource unit
The problem here is to specify a common CPU or memory unit while physical systems are heterogeneous.
CPU limit
- It is expressed in terms of CPU core. Therefore it’s a vCPU / Core in a Cloud architecture and a hypertheaded core when it comes to bare-metal
- As a processor core can be shared by several pods, we also specify a fraction of the use of this core per pod. It can be expressed in core (e.g. 0.5 or half of a core) or in millicore (e.g. 250m or quarter of a core)
- We cannot go below 1m or 0.001 (implicitly in core unit)
Memory limit
- It is expressed either in byte, or in its binary equivalent: 1024 bytes = 1000 bibytes
- It can be simplified with the suffixes K, M, G, T, P, E or in binary Ki, Mi, Gi, Ti, Pi, Ei
Here is a summary table:
| Name | Bytes | Suffix | Name | Bibytes | Suffix |
|---|---|---|---|---|---|
| kilobyte | 103 | K | kibibyte | 210 | Ki |
| megabyte | 106 | M | mebibyte | 220 | Mi |
| gigabyte | 109 | G | gibibyte | 230 | Gi |
| terabyte | 1012 | T | tebibyte | 240 | Ti |
| petabyte | 1015 | P | pebibyte | 250 | Pi |
| exabyte | 1018 | E | exbibyte | 260 | Ei |
Limits Operation in Kubernetes
Kubernetes leaves to Container Runtime (e.g. Docker) the limits management:
- For the CPU, it calculates a quota in second that a pod is allowed to use every 100ms. When a pod goes throught its quota, Docker puts it on hold for 100ms and processes the following pods. If a Pod uses less than its quota, it processes the following pods as well.
- This CPU distribution method is called Completely Fair Scheduler.
- For memory, when
limitsis reached, the Container Runtime will delete the pod (which will then restart) with a Out Of Memory (OOM). - Note also, that when a pod exceeds its
requests, it becomes a candidate for eviction when the host lacks memory resources. It is therefore important not to underestimate the value ofrequests.
Example of a resource configuration in pod
Take the example of the Microservice hasher-java and set up its deployment.
- requests, the quantity of necessary resources, is configured in Kubertes with spec.containers[].Resources.requests.
- limits, the maximum allowable amount, is configured with spec.containers[].Resources.Limits.
For the Microservice hasher-java, you now have this:
apiVersion: apps/v1
kind: Deployment
metadata:
  name: hasher
  namespace: demo
  labels:
    app: hasher
spec:
  replicas: 1
  selector:
    matchLabels:
      app: hasher
  strategy:
    type: RollingUpdate
    rollingUpdate:
      maxUnavailable: 1
      maxSurge: 1
  template:
    metadata:
      name: hasher
      labels:
        app: hasher
    spec:
      containers:
        - image: hasher-jvm:1.0.0
          imagePullPolicy: IfNotPresent
          name: hasher
          resources:
            requests:
              memory: "50Mi"
              cpu: "50m"
            limits:
              memory: "256Mi"
              cpu: "200m"
          ports:
            - containerPort: 8080
              name: http-hasher
              protocol: TCP
          readinessProbe:
            failureThreshold: 3
            httpGet:
              path: /actuator/health
              port: 8080
              scheme: HTTP
            initialDelaySeconds: 10
            periodSeconds: 30
            successThreshold: 1
timeoutSeconds: 2Okay, so we are good now?
Not sure, there are still elements to check like Java … Let’s see what it is.
Java in Kubernetes
The JVM questions the host OS to configure the number of threads for garbage collector and the memory to use. But in a containerized environment, OS information does not reflect container one.
This problem has been addressed since 2017 and is managed properly since Java 10 b34 version as well as later versions. The correction was also reflected on JDKs 8 from the Java 8u191 version. It results in the addition of a parameter -xx:+UseContainerSupports which is activated by default and which allows extraction of good information from the containers.
Other parameters appear along Java versions to refine operation in the containers: -XX:ActiveProcessorCount, -XX:PreferContainerQuotaForCPUCount, -XX:MaxRAMPercentage.
But if you use versions of the JDK integrating UseContainerSupports, everything should be fine.
Demonstration
Let’s see what this new configuration brings to our microservices.
Creating the Kubernetes environment
Let’s start from a Kube environment that contains all the necessary components for our demo:
- A K8S cluster (local)
- Metrics Server
- Prometheus
- Grafana
To do this, run the following commands in the root project:
kubectl apply -f ./k8s/It can take a few minutes before all components are up and running. Grafana is the one which is the most relevant to us.
Dashboard Grafana
Connect and login to the Grafana interface: http://localhost:3000/
The default login / password is admin / admin.
Import the dashboard whose definition is placed under
./grafana/dashboard.jsonfile from the root project.- To do so, go to the Dashboards / Manage menu and click on the Import button.
- Then click on Upload JSON file and select the ./Grafana/dashboard.json file.
- In the prometheus field, select the datasource that has been created and which is called prometheus.
- Click Import.
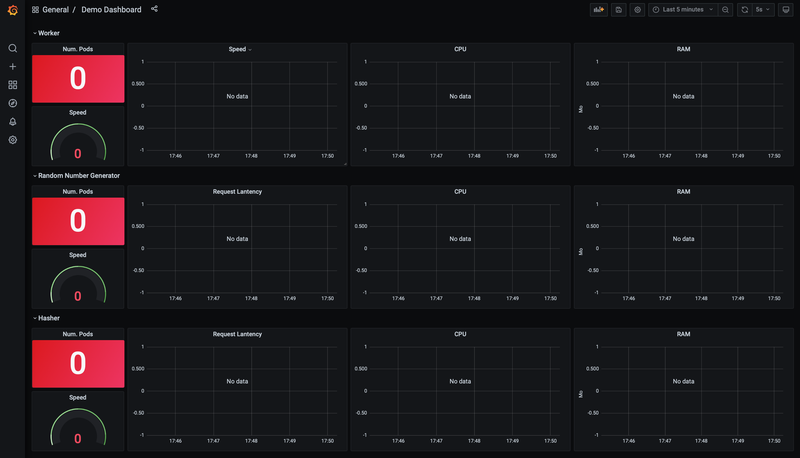
You should see the Dashboard for our demo:
Launch of the demo application and of its Bytecode microServices
We will start the Bytecode-compiled application with 10 workers, 5 hashers and 5 rngs:
kubectl apply -f ./app/demo-jvm.yamlLet’s wait before the application goes up and the docker images stabilizes. After a few minutes, you should see:
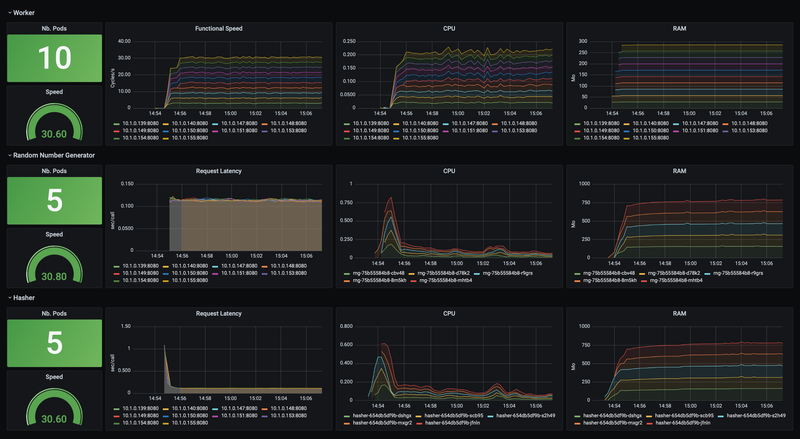
What do we observe?
- For the CPU
- A peak at 700m when deploying Java microservices: the running C1 / C2 compilers.
- Next, there’s a gradual decrease of CPU consumption from 200m to 100m: the result of native code optimization produced by the C2 compiler.
- For RAM
- It quickly rises to 750MB and becomes stable.
Remove the application
Delete the application by launching the following command:
kubectl delete -f ./app/demo-jvm.yamlNow, let’s see what happens in native compiled code during deployment.
Launch of the demo application and its native microservices
Launch the native version of the application:
kubectl apply -f ./app/demo-native.yamlLet it run a few minutes to observe its behavior over time:
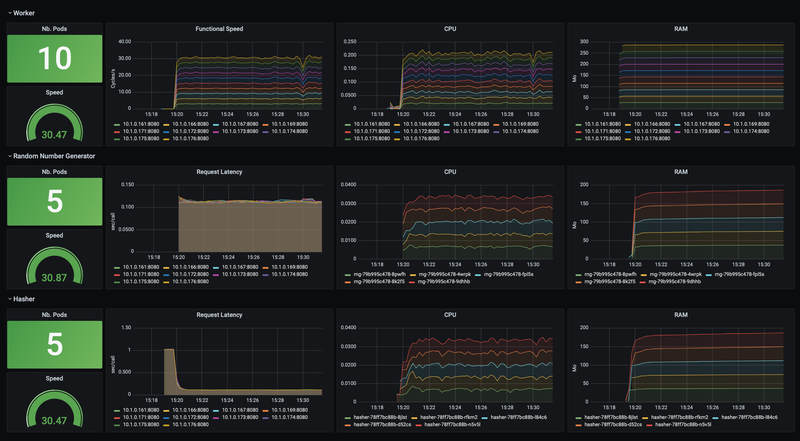
What do we find?
- For the CPU
- No peak of consumption at startup but instead a reduced and regular consumption by up to 35m: indeed, native code has already been compiled and optimized.
- For RAM
- It increases slightly but remains below 200MB.
Conclusion
- In a constrained environment, the native code of our Spring Boot application, produced by Graalvm, consumes 3x less CPU than the same application compiled in Bytecode.
- With regard to memory, there’s also a 4-fold decrease with native code Spring Boot application.
- It differs completely from what we observed in our tests, without CPU and memory constraints onto the pods. As such, we can see the advantage that provides good configuration of pods.
- Note also, for the same Kubernetes cluster (and therefore for the same cost), it will be possible to execute 3x more microservices with native-compiled Spring Boot application.
Therefore the advent of Graalvm marks the beginning of a deep change in the Java ecosystem. Spring’s GraalVM migration will allow our Legacy applications to benefit fully from constrained environments like Cloud. And at the same time, by mastering costs.
Another important point: these tests were made with a non-optimized version of Spring Native, version 0.10.0-SNAPSHOT. Indeed, next iteration 0.11.0 will bring Spring new resources consumption optimizations but there is no doubt that this is already very promising.
Cheers…


