JVM vs Native - An effective comparison of performances
To compare the execution of a Java application between its Bytecode (JVM) and native (GraalVM) versions, you must first decide on its architecture and the framewoks to use. Secondly, we must also ask ourselves what we are going to measure.
Recently, I came across a very interesting course, containers and orchestration, by Jérôme Petazzoni . It uses different Python and Ruby applications which interact by means of Docker containers. They act as a mesh of microservices. The efficiency of the system is measured by the number of treatments performed per second.
It seemed like a good example to serve as a basis for this comparison by:
- Transposing the code into Java language under the Spring Boot / WebFlux frameworks and using Spring Native for the build in Bytecode or in native,
- Playing on the number of containers in order to vary the load of the system.
Let’s see this in detail.
Source code
All sources are kept at https://github.com/scalastic/hotspot-vs-native
UPDATE
The configuration of containers is essential when it comes to measuring memory and CPU consumption. An update of this article is available at JVM vs Native - Configuring Java Containers in Kubernetes
- Requirements
- Application Architecture
- Build the app
- Kubernetes configuration
- Grafana configuration
- Starting the application
- Play with Kubernetes configuration
- Clean all
- Conclusion
- What next?
Requirements
To implement this solution, we will need:
- A Kubernetes cluster to run our containers,
- Different processing measurements from microservices
- Prometheus and Grafana to collect and display these measurements,
- A Java application compilable in Bytecode and native
Well, that’s not much and it already exists:
- In a previous article, I explain how to install a complete Kubernetes, Prometheus and Grafana stack - Locally install Kubernetes, Prometheus, and Grafana,
- By integrating Micrometer with a Java Spring Boot application, it is possible to expose the measurements of its services - HasherHandler.java,
- For a Python application, the prometheus_client library also allows to expose measurements - worker.py,
- By configuring the Maven POM with the
org.springframework.experimental:spring-nativedependency, it is possible to compile the application in Bytecode as well as in native.
Spring version
These are the latest versions of Spring Experimental that will be used to develop our Java microservices. Indeed, they continuously correct and improve the bugs and the performance of the native build. But keep in mind that these are beta versions:
- Spring
2.5.0-RC1 - Spring Native
0.10.0-SNAPSHOT
Application Architecture
Let’s see what the application is made of:
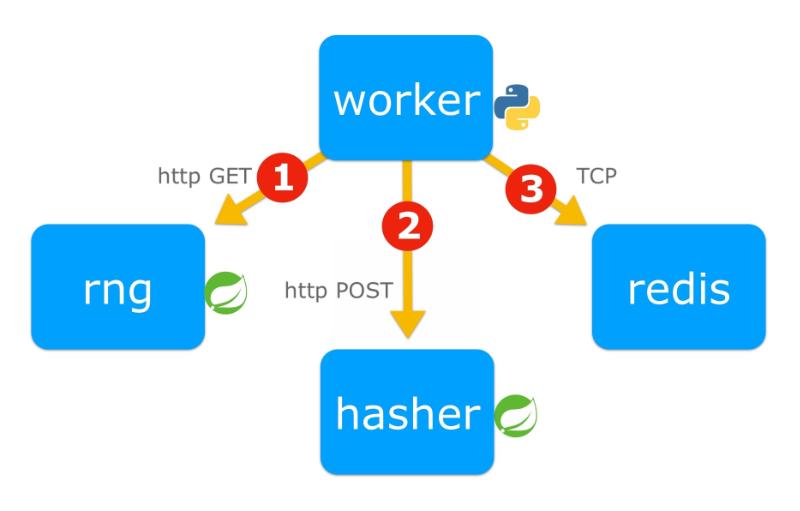
The application is made up of 4 microservices:
worker: the algorithm orchestrator [Python] which gets1a random number,2hash it and3increment a counter in the redis database,rng: the random number generator [Java],hasher: the hash processor [Java],redis: the database which records a processing cycle counter.
Build the app
The purpose of the compilation is to produce one Docker image by microservice. For Java microservices, there will be two images, the first in Bytecode, the second in native.
Optional
I have put these images in a public registry on Docker Hub, so you can skip this build step.
Requirements for the build
However, if you want to create these Docker images, you will need to install:
The easy way
Note
- It should work on Linux and macOS based systems - and on Windows with some small modifications
- It will take time……. 10-20 min depending on your internet connection and processor! That’s the price to compile to native code.
To do so, execute this script in the project root:
./build_docker_images.shSummary of executed commands
- For a non-java app:
docker build -t <app_docker_tag> ./<app_dir>- For JVM-based image:
cd <app_dir>
mvn clean package
docker build -t <app_docker_tag> .- For a Java native image:
cd <app_dir>
mvn spring-boot:build-imageFrom Docker Hub
You can pull pre-build images from Docker Hub by entering:
docker pull jeanjerome/rng-jvm:1.0.0
docker pull jeanjerome/hasher-jvm:1.0.0
docker pull jeanjerome/worker-python:1.0.0
docker pull jeanjerome/rng-native:1.0.0
docker pull jeanjerome/hasher-native:1.0.0Check
To list your local docker images, enter:
docker imagesAt least, you should see these images in your local registry:
REPOSITORY                TAG        IMAGE ID       CREATED             SIZE
rng-jvm                   1.0.0      f4bfdacdd2a1   4 minutes ago       242MB
hasher-jvm                1.0.0      ab3600420eab   11 minutes ago      242MB
worker-python             1.0.0      e2e76d5f8ad4   38 hours ago        55MB
hasher-native             1.0.0      629bf3cb8760   41 years ago        82.2MB
rng-native 1.0.0 68e484d391f3 41 years ago 82.2MBNote
Created time of native images seems inaccurate. It’s not, the explanation is here: Time Travel with Pack
Kubernetes configuration
First, we need to define the kubernetes configuration of our application and tell Prometheus where to find the metrics.
Kubernetes Stack Architecture
Let’s see how to install these microservices in our kubernetes cluster:
- The architecture of the application is deployed in a dedicated namespace,
demo, - The monitoring tools are in another namespace called
monitoring.
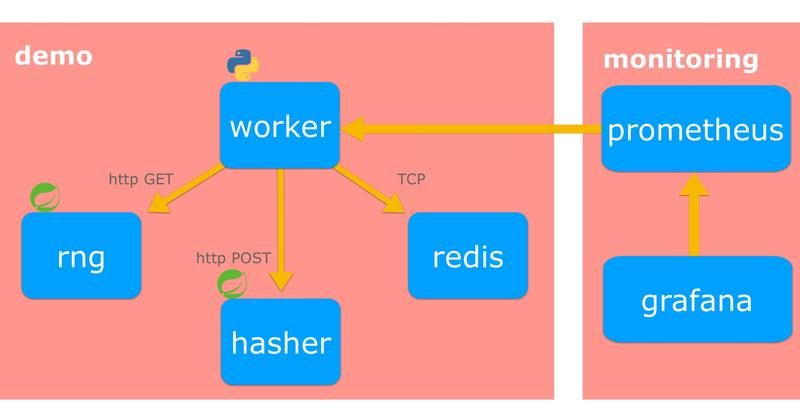
- We want to manage the number of
containers- pods in this case - for each microservice, We also want to be able to change the pod image (Bytecode or native) without needing to redeploy everything.
=> Such Kubernetes resource already exists, Deployment
We need our microservices to communicate with each other in the Kubernetes cluster.
=> This is the job of the resource Service.
The Redis database does not need to be accessible from outside, only from inside the cluster.
=> This is already the case because, by default, Kubernetes Services are of type ClusterIP.
We want application metrics to be collected by Prometheus.
=> Here is how to configure it
Take a look at the Hasher microservice configuration below:
Kubernetes configuration of Hasher microservices
apiVersion: apps/v1
kind: Deployment
metadata:
  name: hasher
  namespace: demo
  labels:
    app: hasher
spec:
  replicas: 1
  selector:
    matchLabels:
      app: hasher
  template:
    metadata:
      name: hasher
      labels:
        app: hasher
    spec:
      containers:
        - image: hasher-jvm:1.0.0
          imagePullPolicy: IfNotPresent
          name: hasher
          ports:
            - containerPort: 8080
              name: http-hasher
              protocol: TCP
          readinessProbe:
            failureThreshold: 3
            httpGet:
              path: /actuator/health
              port: 8080
              scheme: HTTP
            initialDelaySeconds: 10
            periodSeconds: 30
            successThreshold: 1
            timeoutSeconds: 2
---
apiVersion: v1
kind: Service
metadata:
  name: hasher
  namespace: demo
  labels:
    app: hasher
  annotations:
    prometheus.io/scrape: 'true'
    prometheus.io/scheme: http
    prometheus.io/path: /actuator/prometheus
    prometheus.io/port: '8080'
spec:
  ports:
    - port: 8080
      protocol: TCP
      targetPort: http-hasher
  selector:
app: hasherGrafana configuration
To display the metrics collected by Prometheus, Grafana needs:
- A data source to Prometheus,
- A dashboard describing the metrics to display and in what form.
If you followed my previous article Locally install Kubernetes, Prometheus et Grafana, the data source is already configured and you can skip the next step. The Grafana interface is then accessible to http://localhost:3000/
Data source configuration
Grafana uses YAML files to configure a data source. It can be defined using the Kubernetes ConfigMap resource:
apiVersion: v1
kind: Namespace
metadata:
  name: monitoring
---
apiVersion: v1
kind: ConfigMap
metadata:
  name: grafana-datasources
  namespace: monitoring
data:
  prometheus.yaml: |-
    {
        "apiVersion": 1,
        "datasources": [
            {
               "access":"proxy",
                "editable": true,
                "name": "prometheus",
                "orgId": 1,
                "type": "prometheus",
                "url": "http://prometheus-service.monitoring.svc:8080",
                "version": 1
            }
        ]
}It remains to pass this resource to Grafana in the definition of its Deployment:
apiVersion: apps/v1
kind: Deployment
metadata:
  name: grafana
  namespace: monitoring
spec:
  replicas: 1
  template:
    spec:
      containers:
        - image: grafana/grafana:latest
          name: grafana
.../...
          volumeMounts:
            - mountPath: /etc/grafana/provisioning/datasources
              name: grafana-datasources
              readOnly: false
      volumes:
        - name: grafana
          emptyDir: {}
        - name: grafana-datasources
          configMap:
            defaultMode: 420
name: grafana-datasourcesDashboard configuration
- Connect to the Grafana web interface,
- Import the pre-defined dashboard demo-dashboard.json,
- Display the dashboard.
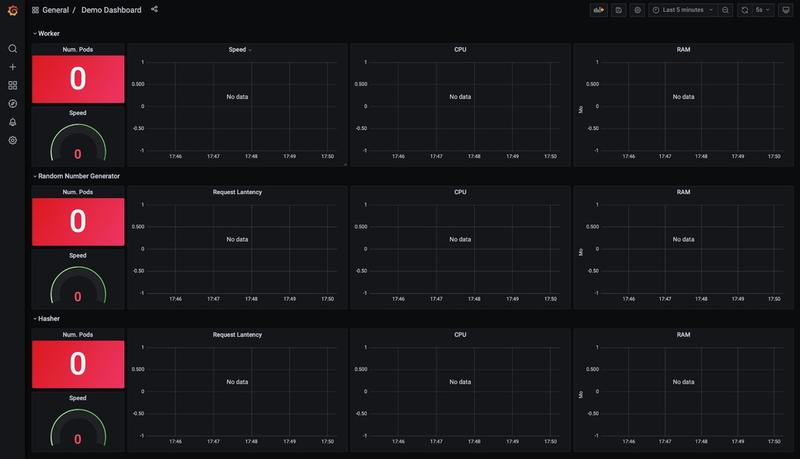
You should see an empty dashboard as follows:
Description of the Demo Dashboard
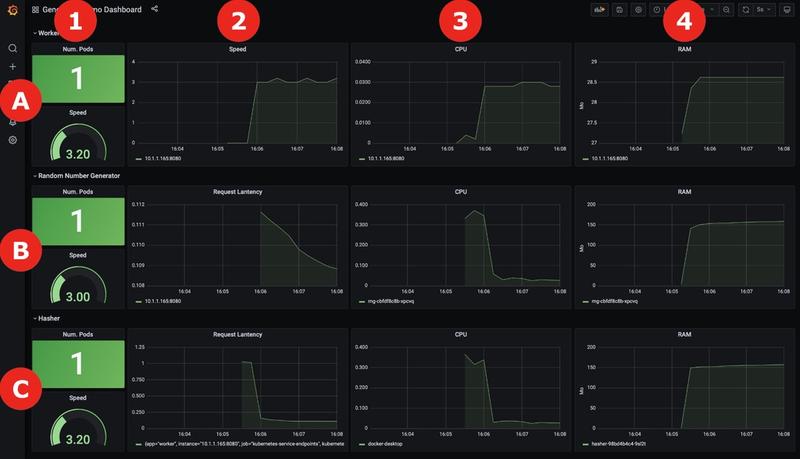
The rows of the table (labeled from A to C) represent the 3 microservices, respectively, Worker, Random Number Generator -RNG- and Hasher.
The columns (numbered 1 to 4) represent different metrics:
- In column 1, we can see the number of pods running as well as the speed of the processes
- In column 2 is displayed the history of processing speeds, for each microservice,
- In column 3 the CPU consumption of each pod is displayed,
- In column 4, the RAM consumption of each pod.
Starting the application
A Kubernetes configuration was created with Replicas of 1 pod for each microservice and Java images compiled in Bytecode.
- To start the application in Kubernetes, enter:
kubectl apply -f _kube/k8s-app-jvm.yml- You should see the output:
namespace/demo created
deployment.apps/hasher created
service/hasher created
deployment.apps/rng created
service/rng created
deployment.apps/redis created
service/redis created
deployment.apps/worker created
service/worker created- Visualize the start of the pods in Grafana:
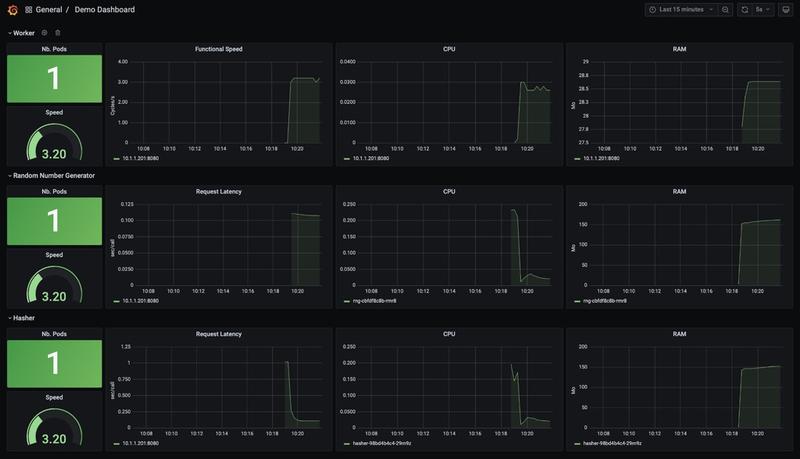
Result
- The observed processing speed, located in cell A1, gives us a basic measure of the efficiency for our application:
3.20cycles / s. - Depending on the resources allocated to your space, you may get a different result.
Play with Kubernetes configuration
Overview
- Let’s see the actual deployment’s situation by entering:
kubectl get deployment -n demo- Which should return:
NAME     READY   UP-TO-DATE   AVAILABLE   AGE
hasher   1/1     1            1           13m
redis    1/1     1            1           13m
rng      1/1     1            1           13m
worker 1/1 1 1 13mIncrease pods’ number
- To scale up
workerpods to2, enter:
kubectl scale deployment worker --replicas=2 -n demo- Which returns:
deployment.apps/worker scaledImpact on the application
- Let’s take a look at the Grafana dashboard:
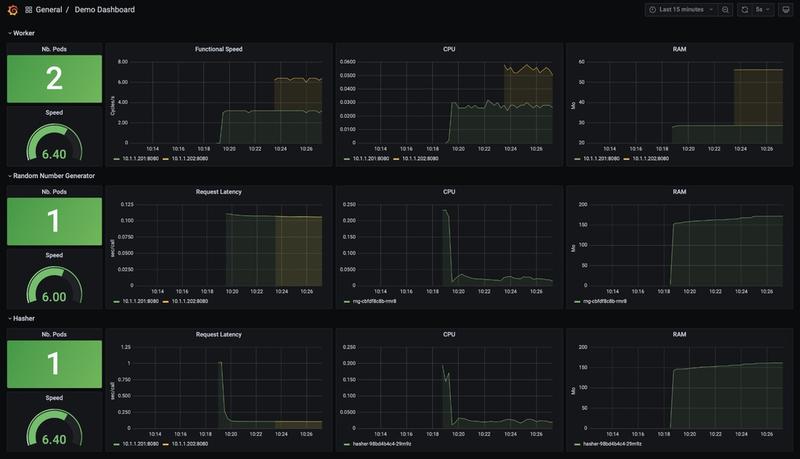
Results
You will notice that the speed of the application is multiplied by x2.
Further increase the number of pods
- Let’s go to 10 workers:
kubectl scale deployment worker --replicas=10 -n demo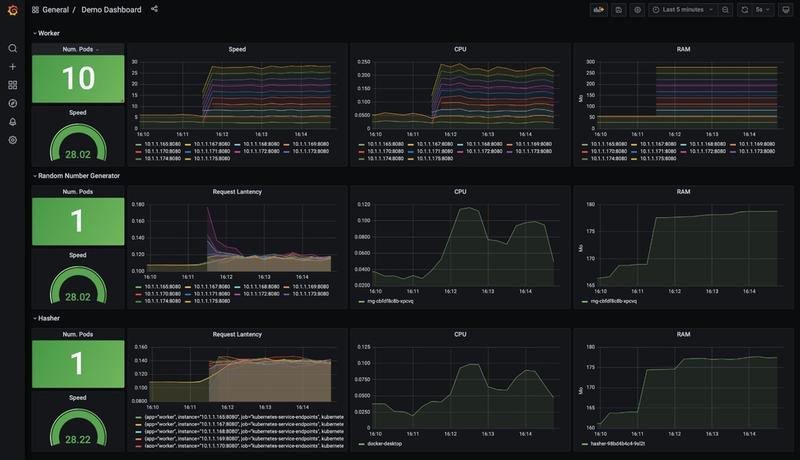
Results
The speed of the process increases, but does not reach exactly 10x more: the latency of the 2 microservices, rng and hasher, which increased slightly, explains this.
- Let’s increase
hasherandrngpods’ number:
kubectl scale deployment hasher rng --replicas=5 -n demo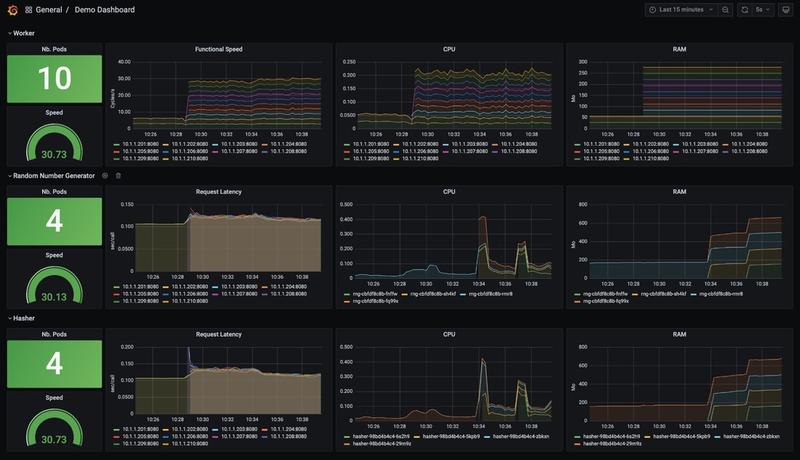
Results
- The increase in the number of
hasherandrngpods has reduced their latency, but it is still a little higher than at the beginning, - Another factor is limiting but we do not see which one in the displayed data.
Let’s deploy the native version of the application
- Replace the current image of the pods with their native version by updating their Deployment:
kubectl set image deployment/hasher hasher=hasher-native:1.0.0 -n demo
kubectl set image deployment/rng rng=rng-native:1.0.0 -n demo- Watch the rollout:
kubectl rollout status deployment/hasher -n demo- And open the Grafana dashboard:
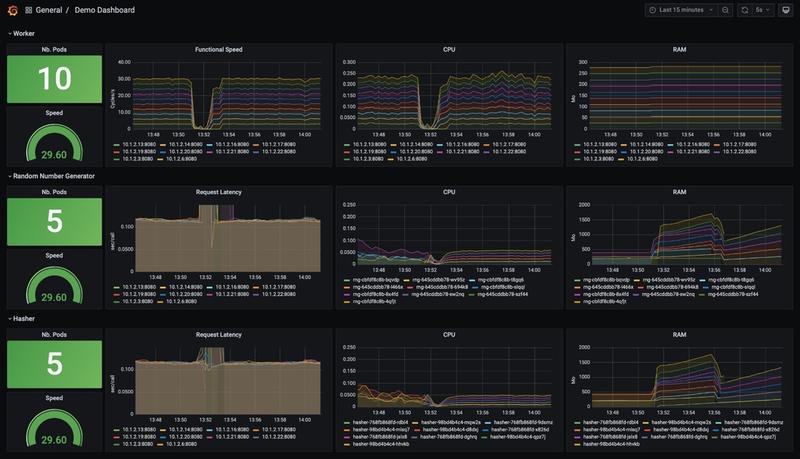
Results
Latency
- No change for the responsiveness of the microservices: undoubtedly, the code is too simple to benefit from a native build.
CPU usage
- With Bytecode, CPU usage tended to decrease over time. This was due to the action of the HotSpot
C2compiler which produces native code that is increasingly optimized over time. - In contrast, native processor usage is low from the start.
RAM usage
- Surprisingly, native applications use more memory than Bytecode ones: it is all the more surprising that reducing the memory footprint is one of the advantages cited by the community.
Is it because of the Beta versions used in this demo or a memory leak in the implementation?
UPDATE
The configuration of containers is essential when it comes to measuring memory and CPU consumption. An update of this article is available at JVM vs Native - Configuring Java Containers in Kubernetes
Clean all
- To simply remove the app and all its microservices, enter:
kubectl delete -f _kube/k8s-app-jvm.yml- which will remove all the Kubernetes configuration created previously:
namespace "demo" deleted
deployment.apps "hasher" deleted
service "hasher" deleted
deployment.apps "rng" deleted
service "rng" deleted
deployment.apps "redis" deleted
service "redis" deleted
deployment.apps "worker" deleted
service "worker" deletedConclusion
We learned how to install a full Kubernetes stack so that we can measure application metrics.
However, we are not getting the results we expect in the context of native applications. One explanation could be a lack of the Spring Beta version: Spring Native has just upgraded to version 0.10.0-SNAPSHOT and this is precisely the version where performance improvements are planned.
I’ll open a ticket with the Spring Boot team to ask for their analysis.
UPDATE
The configuration of containers is essential when it comes to measuring memory and CPU consumption. An update of this article is available at JVM vs Native - Configuring Java Containers in Kubernetes
What next?
What is missing for a more realistic evaluation?
- Kubernetes configuration should always include a resource limit which has not been done in this demo.
- I could have used Horizontal Pod Autoscaler (HPA) and even better HPA on custom metrics (read this post for more details).
Question
- I wish I found something on self-regulating Scalers, able to maximize a metric but nothing about such a thing…
- Have you ever heard of something like that?
Useful links
Here are some links for further reading:
- Jérôme Patazzoni’s container training: https://github.com/jpetazzo/container.training
- Kubernetes Concepts : https://kubernetes.io/docs/concepts/
- Monitoring your apps in Kubernetes with Prometheus and Spring Boot: https://developer.ibm.com/technologies/containers/tutorials/monitoring-kubernetes-prometheus/
- Prometheus Python Client: https://github.com/prometheus/client_python
- Custom Prometheus Metrics for Apps Running in Kubernetes: https://zhimin-wen.medium.com/custom-prometheus-metrics-for-apps-running-in-kubernetes-498d69ada7aa
Well, that’s your turn playing with native apps now!
Cheers…


